Graphs are a vital step in modeling and analyzing the data.
List of the most useful graphs
There are many others such as: heatmaps, treemaps, pie charts, dot plots, 3d plots, and so on. However, I feel most of the graphs should only be used in specific cases.
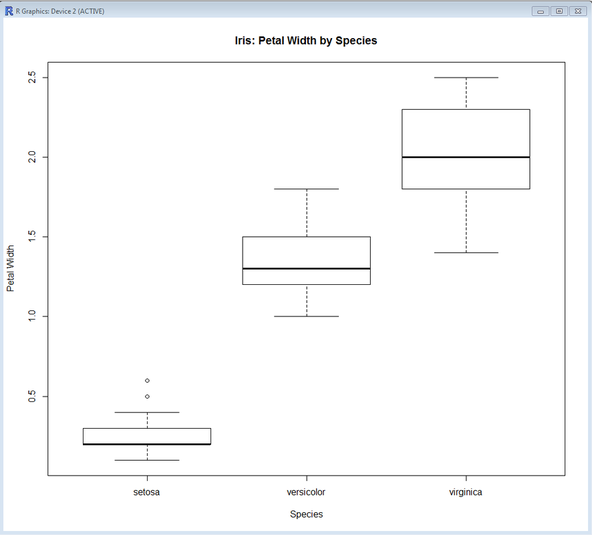
boxplot(Petal.Width~ Species,data=iris, main="Iris: Petal Width by Species",
xlab="Species", ylab="Petal Width")
List of the most useful graphs
- Boxplot
- Histogram
- Density
- Barchart
There are many others such as: heatmaps, treemaps, pie charts, dot plots, 3d plots, and so on. However, I feel most of the graphs should only be used in specific cases.
boxplot(Petal.Width~ Species,data=iris, main="Iris: Petal Width by Species",
xlab="Species", ylab="Petal Width")
 RSS Feed